Understanding COVID-19’s Wrath on the Populations of USA, India, and Brazil: Rohan S. Kulkarni1, MBBS, MS, Salva G. Ahmed2, MD, Sunil S. Kulkarni3, PhD, MBA, CFA, Virendra K. Bhojwani4, PhD
1. Dr. DY Patil Medical College, Hospital & Research Centre, Pimpri, Pune, India
2. Brookville Family Care, Premier Health Family Medicine, Brookeville, Ohio, USA
3. Department of Engineering Management, Systems, and Technology, School of Engineering, University of Dayton, Ohio, USA
4. Department of Mechanical Engineering, MIT Art, Design and Technology University, Pune, India
ABSTRACT
Background: As of March 2024, the populations of the USA, India, and Brazil have suffered over 2.4M combined COVID-19 deaths and are ranked as the top three countries in the world with the most fatalities due to the virus. Their populations differ significantly regarding their races/ethnicities, population densities, urbanization proportions, GDPs (Gross Domestic Products), age profiles, and COVID vaccinations. However, surprisingly they are bunched up at the top when it comes to the world’s COVID-19 deaths.
Aims: This paper examines these populations, with a combined 194M infections and counting, to provide a comprehensive understanding and explore the social inferences of the virus.
The main objectives of this study are to comprehend similarities and differences of the three populations for race, age, income, population density, urbanization, and effectiveness of the COVID-19 vaccines.
Methods: To understand COVID-19’s underlying deaths in a country, its demographic and economic data were analyzed.
Results: For the US, in terms of population proportion of a race, the Whites saw a higher percentage of COVID-19 deaths, while the Blacks’ deaths were in line with its proportion but both the Hispanics and Asians saw lower COVID-caused deaths than their proportions. For the country, 90% of these deaths were for the ages of over 55 years. Surprisingly the 0-17 years age group saw only 0.15% of total 1.2M COVID-19 deaths.
Brazil did experience the second highest COVID-19 deaths in the world. 80% of these deaths occurred in 11 states out of the country’s 26. The same states have 70% of Brazil’s population creating 65% of the country’s GDP.
India, the world’s most populated country, experienced the third-highest COVID-19 deaths in the world. 87% of its COVID deaths came from 14 states out of the country’s 28. These states have 85% of India’s population produced 89% of the country’s GDP. India’s top five COVID-caused deaths producing states experienced 60% of these deaths.
Conclusions: The top five COVID-19 deaths-producing states for both the USA and Brazil were driven by population and GDP rankings. A blend of GDP, total population, urbanization, and median age were key drivers for India’s COVID-19 deaths.
Keywords: COVID-19 deaths, Vaccination, Race, Age, GDP, USA, India, Brazil
1. Introduction
In 2020, the US total deaths climbed by 600K from 2.8M in 2019. COVID-19 became a third leading cause of death killing 351K people. In 2021, the country experienced more than 3.4M deaths due to various causes which was a jump of 80K from 2020. In the same period, COVID-19 being the principal cause of death amplified 19% from 351K in 2020 to 417K in 2021. In 2022 the US witnessed about 3.3M total deaths with COVID-19 being a fourth underlying cause killing 187K1-3.
The total number of deaths in India reached about 15M in 2021, which was an increase of about 50% from 2020 of 10.3M. The 2020 deaths in the country were a 400K increase from 9.9M in 2019. India’s total deaths did drop to about 14.6M in 2022 and to 13.9M in 20234.
Brazil saw the highest number of total deaths 1.54M in 2020 from 1.41M in 2019. In 2021, the country’s deaths reached about 1.49M which was a decline of 2.6% from the prior year. Brazil did see a further drop in number of fatalities to 1.46M in 2022 but a slight uptick to 1.49M in 20235.
The populations of the USA, Brazil, and India have a grim milestone of having the most deaths in the world caused by the COVID-19 virus. This paper looks at each of the top three fatalities experienced in countries for their population demographics, urbanization, gross domestic product (GDP), and vaccination percentage to understand their COVID-19 deaths.
2. Materials and Methods
To comprehend better about COVID-19’s underlying deaths for a country, its demographic and economic data are important pieces of the puzzle.
2.1. Data retrieval
For mortality statistics, we used CDC’s (Centers for Disease Control’s) data for the USA1-3, and ‘GlobalData’ for both India4 and Brazil5. Additional data for COVID-19 cases and deaths were obtained from ‘Worldometer’ for these top three death-producing countries6-8. For the US, we retrieved race-based data from the CDC9 and the population details from the U.S. Census Bureau10. The vaccination information for each country was obtained from John Hopkins University’s data tracking11.
We also retrieved each country’s population12, urbanization data13, and Gross National Income (GNI) per Capita14. Population Pyramid databases provided us with the age breakdown of these three countries15-17. USA’s COVID-19 deaths by state18 and GDP by state19 were obtained for micro-level understanding of the country. Brazil’s COVID-19 state-wise deaths20, population21, and GDP22 were obtained for micro-level understanding of the country. To perform India’s micro-based analyses by states, COVID-19 cases and deaths23, population24, GDP25, median age26, and urbanization data27 were obtained.
2.2. COVID-19 cases and deaths
Populations of the USA, India, and Brazil have experienced about 200M cases of COVID-19 infections over the past four years as depicted in Figure 16-8. Fortunately, the cases have leveled off for these populations.
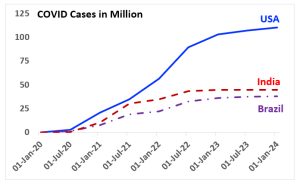
Figure 1. COVID-19 cases in the USA, India, and Brazil6-8
A visual display in Figure 2 demonstrates that the US population has experienced the most deaths due to the virus in the world totaling about 1.2M followed by Brazil and India6-8.
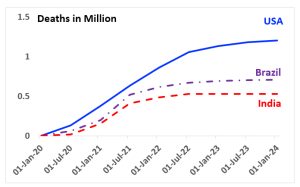
Figure 2. COVID-19 deaths in the USA, India, and Brazil6-8
In Figure 3, we depict the percentage of COVID-19 cases that caused deaths dropping significantly over the past four years6-8. USA population percentage deaths have dropped to India’s level but surprisingly Brazil has not seen a similar drop.
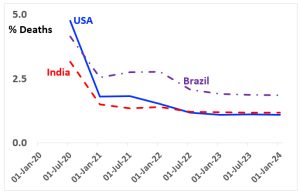
Figure 3. % of COVID-19 cases resulting in deaths in the USA, India, and Brazil6-8
2.3. COVID-19’s impact on the US population
Based on the U.S. Government reports, Tables 1 through 4 show COVID-19 deaths by age groups and races9, 10. As per Table 1, the USA experienced 1.15M deaths due to the virus through September 2023. The Whites had 66.2% (759K) of these deaths, followed by 15% (172K) by the Hispanics, 13.7% (157K) by the Blacks, and 3.1% (36K) by the Asians.
Compared to the July 2023 census data, the Whites 58.9% of the US population saw a higher percentage of COVID-19 deaths of 66.2%. The deaths of the Blacks’ of 13.7% was in line with the country’s population of 13.6%. Both Hispanics and Asians saw lower COVID-19 underlying deaths than their population proportions (Hispanics 19.1% of the population experienced 15% of fatalities while Asians 6.3% of the population saw 3.1% of deaths).
Table 1. USA: COVID-19 Deaths for All Age Groups (Jan. 2020-Sept. 2023)9 vs. 2023 Census10
| Age Group | Race | COVID Deaths | % of Total Covid Deaths | July 2023 Census |
| All Ages | Non-Hispanic White | 759,258 | 66.21% | 58.9% |
| All Ages | Non-Hispanic Black | 157,169 | 13.71% | 13.6% |
| All Ages | Non-Hispanic American Indian or Alaska Native | 12,122 | 1.06% | 1.3% |
| All Ages | Non-Hispanic Asian | 35,967 | 3.14% | 6.3% |
| All Ages | Non-Hispanic Native Hawaiian or Other Pacific Islander | 2,323 | 0.20% | 0.3% |
| All Ages | Non-Hispanic More than one race | 4,419 | 0.39% | — |
| All Ages | Hispanic | 172,235 | 15.02% | 19.1% |
| All Ages | Unknown | 3,194 | 0.28% | — |
| Total | All Races | 1,146,687 | 100% | 100% |
Table 2 depicts COVID-19 deaths in the USA by Age Groups for all the races combined. The COVID-19-caused deaths were truly for the older population. 90% of these deaths were for the ages over 55 years while about 75% of them were for the ages of 65 and above.
Table 2. USA: COVID-19 Deaths for Races by Age Groups (Jan. 2020-Sept. 2023)9
| Age Group | Race | COVID-19 Deaths | % Covid Deaths | % Cumulative Deaths |
| Under 1 year | All Races | 516 | 0.04% | 0.04% |
| 1-4 years | All Races | 286 | 0.02% | 0.07% |
| 5-14 years | All Races | 508 | 0.04% | 0.11% |
| 15-24 years | All Races | 3,018 | 0.26% | 0.38% |
| 25-34 years | All Races | 12,398 | 1.08% | 1.46% |
| 35-44 years | All Races | 30,097 | 2.62% | 4.08% |
| 45-54 years | All Races | 71,391 | 6.23% | 10.31% |
| 55-64 years | All Races | 159,703 | 13.93% | 24.24% |
| 65-74 years | All Races | 256,787 | 22.39% | 46.63% |
| 75-84 years | All Races | 300,140 | 26.17% | 72.80% |
| 85 years and over | All Races | 311,843 | 27.20% | 100.00% |
| All Ages | All Races | 1,146,687 | 100% | 100% |
As per Table 3, for the US, the 0-17 years age group saw less than 1,700 COVID-19 deaths (0.15%) out of a total of 1.15M for all the age groups. The low death proportion for the younger population was truly independent of the race.
Table 3. USA: COVID-19 Deaths for 0-17 Years Age Group (Jan. 2020-Sept. 2023)9
| Age Group | Race | COVID Deaths | Total COVID Deaths | % Covid Deaths |
| 0-17 years | Non-Hispanic White | 642 | 759,258 | 0.08% |
| 0-17 years | Non-Hispanic Black | 437 | 157,169 | 0.28% |
| 0-17 years | Non-Hispanic American Indian or Alaska Native | 29 | 12,122 | 0.24% |
| 0-17 years | Non-Hispanic Asian | 61 | 35,967 | 0.17% |
| 0-17 years | Non-Hispanic Native Hawaiian or Other Pacific Islander | 16 | 2,323 | 0.69% |
| 0-17 years | Non-Hispanic More than one race | 55 | 4,419 | 1.24% |
| 0-17 years | Hispanic | 445 | 172,235 | 0.26% |
| 0-17 years | Unknown | 8 | 3,194 | 0.25% |
| Total | All Races | 1,693 | 1,146,687 | 0.15% |
To understand Table 2 further for the 0-54 years age group deaths of being 10.31% of the overall deaths for all races combined, we tabulated Table 4 for the individual races. The Whites had a lower proportion of deaths 6.66%, while the Blacks and the Hispanics had higher proportions of deaths 15.75% and 20.18% respectively. The Asians had 9.56% deaths for the age group which was in line with the overall death of 10.31%. The last column in the table shows the deaths for ages of 55 years and above. For the 5 years and above age group, the Whites had higher than average deaths, while both the Blacks and Hispanics had lower than average deaths for the county of 90%.
Table 4. USA: COVID-19 Deaths for 0-54 And 55+ Years Age Groups (Jan. 2020-Sept. 2023)9
| Age Group | Race | COVID Deaths 0-54 Years |
COVID Deaths All Ages Total |
% of COVID Deaths 0-54 Years |
% of COVID Deaths 55 Years and above |
| 0-54 years | Non-Hispanic White | 50,572 | 759,258 | 6.66% | 93.34% |
| 0-54 years | Non-Hispanic Black | 24,759 | 157,169 | 15.75% | 84.25% |
| 0-54 years | Non-Hispanic American Indian or Alaska Native | 2,726 | 12,122 | 22.49% | 77.51% |
| 0-54 years | Non-Hispanic Asian | 3,440 | 35,967 | 9.56% | 90.44% |
| 0-54 years | Non-Hispanic Native Hawaiian or Other Pacific Islander | 734 | 2,323 | 31.60% | 68.40% |
| 0-54 years | Non-Hispanic More than one race | 934 | 4,419 | 21.14% | 78.86% |
| 0-54 years | Hispanic | 34,759 | 172,235 | 20.18% | 79.82% |
| 0-54 years | Unknown | 290 | 3,194 | 9.08% | 90.92% |
| Total | All Races | 118,214 | 1,146,687 | 10.31% | 89.69% |
2.4. Understanding effects of COVID-19 vaccinations
Our world saw the development of many vaccines to fight against the COVID-19 virus. About 82% of the US population have received at least one vaccine dose so far while the number is 89% and 75% for Brazil and India respectively as shown in Figure 411, 12.
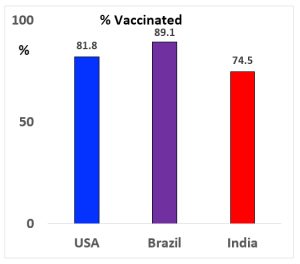
Figure 4. % population getting at least one vaccination dose11, 12
Considering the populations12 of the top three COVID-19 underlying deaths countries6-8, the percentage dying due to the virus is the highest in the US at 0.36 while 0.33 in Brazil and only 0.04 for India as depicted in Figure 5. India with the lowest vaccination proportion, compared to both the USA and Brazil proportions, surprisingly has the lowest death percentage in its population due to the virus.
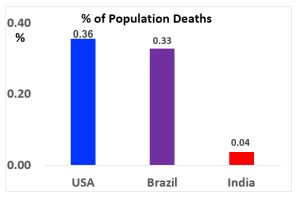
Figure 5. % of population deaths in the USA, India, and Brazil6-8,12
3. Effects of urbanization and economic activities on COVID-19 deaths
We next look at the urbanization of these three countries since the percentage of vaccinated population (Figure 4) does not correlate with the percent deaths for them. The USA and Brazil have above 80% urbanization while India lags significantly with only 36%13. The urbanization proportions, similar to the vaccination proportion thus do not correlate percent deaths for these countries.
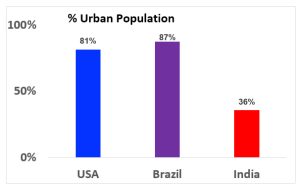
Figure 6. % urban population in the USA, India, and Brazil13
Economic activities bring people together. Close interactions of people have a high potential for COVID-19 transmission. Gross National Product (GNP) per Capita is significantly higher for the USA ($76.8K) compared to both Brazil ($8.1K) and India ($2.4K)14. The combination of urbanization with GNP/Capita does follow the percent population deaths in these three countries.
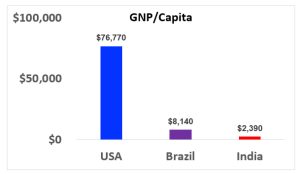
Figure 7. GNP/Capita in the USA, India, and Brazil14
4. Age and COVID-19 deaths
In this section we will study how COVID-19 deaths are linked with a country’s population age.
4.1 Understanding USA’s Population
Based on the US data in Tables 1 through 4, age is an important factor for the COVID-19 underlying deaths. Regardless of race, ages below 54 years have seen about 10% of the fatalities and ages above 55 have seen 90% of these deaths. In this regard population age analysis is important for the three nations.
USA’s 2023 population by age groups, as shown in Figure 8, peaks for the age group of 30-34 years and is relatively constant from 0-4 years through 65-69 years groups15. The cumulative population proportion derived from Figure 8 is displayed in Figure 9 showing that the median age is 39 years for the country.
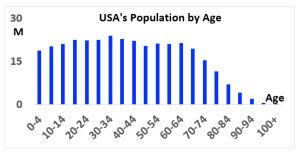
Figure 8. USA’s 2023 population by age15
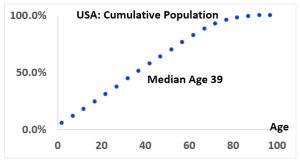
Figure 9. USA’s 2023 cumulative population by age15
4.2 Understanding India’s Population
India’s 2023 population by age groups, shown in Figure 10, peaks for the 20-24 years group16. The cumulative population proportion derived from Figure 10 is displayed in Figure 11 showing that India’s median age is 28 years.
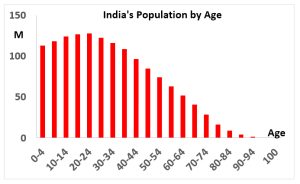
Figure 10. India’s 2023 population by age16
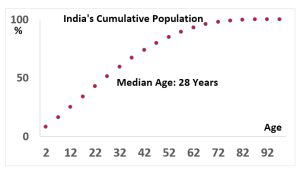
Figure 11. India’s 2023 cumulative population by age16
4.3 Understanding Brazil’s Population
Brazil’s 2023 population by age groups, shown in Figure 12, peaks for the 35-39 years age group17. The cumulative population proportion derived from Figure 12 is displayed in Figure 13 which shows that Brazil’s median age is 34 years.
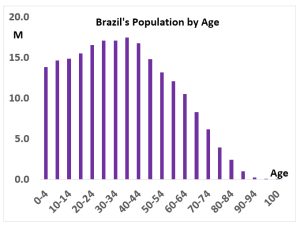
Figure 12. Brazil’s 2023 population by age17
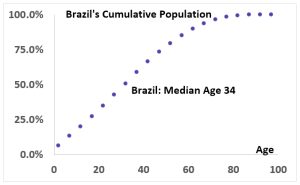
Figure 13. Brazil’s 2023 cumulative population by age17
4.4 Comparing median ages of USA, Brazil, and India
The top three COVID-19 deaths producing countries of the USA, Brazil, and India, shown in Figure 14, do track well with the % of population deaths displayed in Figure 5. This confirms that the older the proportional population (e.g. USA w/ 39 years median age yielding 0.36% of population deaths) the higher the deaths and vice versa (e.g. India w/ 28 years median age yielding 0.04% of population deaths). Brazil’s statistics are between the other two nations.
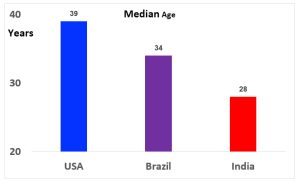
Figure 14. Median ages in the USA, Brazil, and India15-17
5. Understanding state level GDP, Population and COVID deaths
In this section will attempt to further understand relationships between GDP, population, and COVID deaths but at the state level in each of the three countries of interest.
5.1 Analysis of GDP, Population, and COVID-19 deaths at the state level for the USA
The USA ranks number one in the world with its GDP of $26 Trillion and has a population of 340M. This highest GDP-producing country did experience the most COVID-19 underlying deaths in the world. Table 5 shows the USA’s top 11 states out of 50 when it comes to GDP, their populations, and COVID deaths18, 19. Interestingly 56% of the country’s COVID-19 deaths occurred in these 11 states. The same states have 55% of the total population with 59% of the country’s GDP. The top five COVID-19 deaths-producing states track well with their population ranking and also their GDP ranking.
Table 5. USA’s States’ GDP, Population, and COVID Deaths18, 19
| USA | GDP (Trillion) $25.74 |
Population M 340 |
COVID Deaths M 1.218 |
GDP Rank | Population Rank | COVID Deaths Rank |
| California | 3.64 | 39.5 | 0.112 | 1 | 1 | 1 |
| Texas | 2.4 | 29 | 0.105 | 2 | 2 | 2 |
| Florida | 1.44 | 21.5 | 0.095 | 4 | 3 | 3 |
| New York | 2.05 | 19.5 | 0.083 | 3 | 4 | 4 |
| Pennsylvania | 0.91 | 12.8 | 0.052 | 6 | 5 | 5 |
| Michigan | 0.62 | 10 | 0.045 | 11 | 10 | 6 |
| Georgia | 0.77 | 10.6 | 0.044 | 8 | 8 | 7 |
| Ohio | 0.83 | 11.7 | 0.044 | 7 | 7 | 8 |
| Illinois | 1.03 | 12.7 | 0.042 | 5 | 6 | 9 |
| New Jersey | 0.75 | 8.9 | 0.037 | 9 | 11 | 10 |
| North Carolina | 0.72 | 10.5 | 0.029 | 10 | 9 | 11 |
5.2 Analysis of GDP, Population, and COVID-19 deaths at the state level for Brazil
Brazil ranks number 11 in the world with its GDP of $1.9 Trillion and has a population of 216M. The country experienced the second highest COVID-19 deaths in the world. Table 6 shows Brazil’s top 11 states when it comes to GDP, population, and COVID-19 deaths20-22. 80% of the country’s COVID-19 deaths occurred in these 11 states out of the country’s 26 and one federal district. The same states have 70% of the total population and create 65% of Brazil’s GDP. The top five COVID-19 deaths-producing states follow well with their population ranking and also their GDP ranking.
Table 6. Brazil’s States’ GDP, Population, and COVID Deaths20-22
| Brazil | GDP USD Billion $1,920 |
Population M 216 |
COVID Deaths 709,000 |
GDP Ranking | Population Ranking |
COVID Deaths Ranking |
| São Paulo | 475.6 | 44.4 | 180,887 | 1 | 1 | 1 |
| Rio de Janeiro | 152.0 | 16.1 | 77,344 | 2 | 3 | 2 |
| Minas Gerais | 136.6 | 20.5 | 65,740 | 3 | 2 | 3 |
| Paraná | 97.6 | 11.4 | 46,441 | 4 | 5 | 4 |
| Rio Grande do Sul | 94.2 | 10.9 | 42,417 | 5 | 6 | 5 |
| Bahia | 61.0 | 14.1 | 31,677 | 7 | 4 | 6 |
| Goiás | 44.8 | 7.1 | 28,297 | 9 | 10 | 7 |
| Ceará | 33.4 | 8.8 | 28,210 | 13 | 8 | 8 |
| Pernambuco | 38.6 | 9.1 | 23,004 | 11 | 7 | 9 |
| Santa Catarina | 69.8 | 7.6 | 22,856 | 6 | 9 | 10 |
| Pará | 43.2 | 0.8 | 22,856 | 10 | 25 | 11 |
5.3 Analysis of GDP, Population, and COVID-19 deaths at the state level for India
India, the world’s most populated country with a population of 1.34 Billion, ranks number 5 in the world when it comes to its GDP of $3.4 Trillion. The country experienced the third-highest COVID-19 deaths in the world. Table 7 shows India’s top 14 states with their COVID deaths, population, urban population, and median age20-22. 87% of the country’s COVID-19 deaths occurred in these 14 states out of 28 and 8 Union territories. These 14 states have 85% of the total population producing 89% of the country’s GDP. The top five COVID-19 deaths producing states experienced 60% of India’s COVID-19 deaths.
In Table 8 we share the rankings for GDP, Population, Urbanization, Median Age, and COVID-19 Deaths for these 14 states. The state of Maharashtra, with the highest GDP ranking, second in population, first in Urban population, and 5th in median age, experienced the most (and 28% of the total) deaths in India. The state of Kerala experienced the second most COVID deaths in the country but is ranked 11th in the GDP, and 9th in both population including urbanization.
The prominent reason Kerala experienced the second most deaths in the country is because its population is ranked first in median age, in other words, it has the oldest population in the country. The state of Bihar is second in population as Maharashtra but ranks 11th for urban population. The state with the country’s youngest population (median age of only 22) ranked 11th for the COVID deaths in the country. A combination of GDP, total population, urban population, and median age are thus important drivers for India’s COVID-19 deaths.
Table 7. India’s States’ Rankings for GDP, Population, and COVID Deaths23-27
| India | GDP $3385B |
Population M 1,340 |
Urban Population, M 426.1 | Median Age Years 28 |
COVID Deaths 533,535 |
% of COVID Deaths |
| Maharashtra | $531 | 127 | 58.2 | 31.3 | 148,594 | 27.85% |
| Kerala | $159 | 36 | 18.9 | 35.1 | 72,104 | 13.51% |
| Karnataka | $210 | 68 | 26.9 | 31.4 | 40,399 | 7.57% |
| Tamil Nadu | $308 | 81 | 39.9 | 34.2 | 38,086 | 7.14% |
| Delhi | $156 | 21 | 20.6 | 30 | 26,689 | 5.00% |
| Uttar Pradesh | $311 | 237 | 53.6 | 24.7 | 23,723 | 4.45% |
| West Bengal | $254 | 99 | 32.4 | 31.5 | 21,558 | 4.04% |
| Punjab | $105 | 30 | 11.5 | 32 | 20,583 | 3.86% |
| Andhra Pradesh | $166 | 53 | 16.2 | 32.5 | 14,733 | 2.76% |
| Chhattisgarh | $70 | 30 | 7.2 | 26.9 | 14,200 | 2.66% |
| Bihar | $119 | 127 | 14.6 | 22 | 12,315 | 2.31% |
| Gujarat | $278 | 72 | 31.4 | 29.3 | 11,096 | 2.08% |
| Madhya Pradesh | $156 | 87 | 24.3 | 26 | 10,786 | 2.02% |
| Rajasthan | $186 | 77 | 19.4 | 25.6 | 9,746 | 1.83% |
Table 8. India’s States’ Rankings for GDP, Population, and COVID Deaths23-27
| India | GDP State Rank | Population Rank | Urban Population Rank | Median Age Rank | COVID Deaths Rank |
| Maharashtra | 1 | 2 | 1 | 5 | 1 |
| Kerala | 11 | 9 | 9 | 1 | 2 |
| Karnataka | 6 | 8 | 6 | 7 | 3 |
| Tamil Nadu | 3 | 5 | 3 | 2 | 4 |
| Delhi | 10 | 19 | 8 | 6 | 5 |
| Uttar Pradesh | 2 | 1 | 2 | 11 | 6 |
| West Bengal | 5 | 3 | 4 | 5 | 7 |
| Punjab | 12 | 10 | 12 | 4 | 8 |
| Andhra Pradesh | 8 | 8 | 10 | 3 | 9 |
| Chhattisgarh | 14 | 10 | 13 | 8 | 10 |
| Bihar | 13 | 2 | 11 | 28 | 11 |
| Gujarat | 4 | 7 | 5 | 6 | 12 |
| Madhya Pradesh | 9 | 4 | 7 | 10 | 13 |
| Rajasthan | 7 | 6 | 9 | 9 | 14 |
6. Discussion
The Lancet studies discovered that US states with greater poverty, lesser education, and to a lesser extent availability for quality health care felt excessively higher rates of COVID-19 deaths28.
US
For the US, by September 2023, COVID-19 deaths have already exceeded 1.12M. Demographic factors of age, race, and residence state were found to be significant in our analyses. The ages of 55 years and above saw 90% of overall COVID-19 underlying deaths while the 0-17 years age group saw insignificant (only 0.15%) of total virus-related deaths. Race/ethnicity seems to have played an important role also, as the Whites’ death proportion is higher than their population proportion while both the Asians’ and Hispanic death proportions are lower than their respective population proportions.
Our analyses parallel the meta-analyses based on 59 studies containing 36K patients exhibited that patients belonging to the 70 years and above age group had a higher risk for COVID-19 death29.
Brazil
Brazil’s COVID-19 mortality can be explained by its socio-economic and healthcare inequalities which include weaknesses of its universal healthcare system30. Brazil experienced the second highest COVID-19 deaths in the world. 80% of Brazil’s COVID-19 deaths occurred in 11 states out of its 26. These 11 states have 70% of the country’s population and create 65% of its GDP. Brazil’s top five COVID-19 deaths-producing states followed well with their population ranking as well as their GDP ranking. Our analysis is in line with the conclusions of a 3-year COVID-19 epidemiological studies in Brazil by Martins et al. about the regional differences that are present in the national territory31.
Ghosh et al. by May 2020 in India discovered that Maharashtra, Delhi, Gujarat, Madhya Pradesh, Andhra Pradesh, Uttar Pradesh, and West Bengal were in the stern category for COVID-19 deaths. Tamil Nadu, Rajasthan, Punjab, and Bihar saw modest number of deaths. On the other hand populations of Kerala, Karnataka, and Telangana states had relatively lowest COVID-19 deaths32.
India
India, with a population of 1.34 Billion, experienced the third-highest number of COVID-19 deaths in the world. About 90% of India’s COVID-19 deaths occurred in half of its states. These 14 states have 85% of the country’s population and produce about 90% of its GDP. The state of Maharashtra, with the highest GDP rank, second in population, first in Urban population, and 5th in median age, experienced the most COVID-19 deaths in the country. The key reason the state of Kerala experiencing the second most deaths in India is because its population is the oldest in the country. Individual states’ GDP, urban population, and median age were prominent factors for India’s COVID-19 deaths.
Swain et al.’s study for the Indian population found that males and the older age groups were more vulnerable to the influence of COVID-1933. The age related COVID-19 death results match well with our analyses. However, our study did not focus on gender.
COVID-19
COVID-19 vaccinations have helped the world in combating the deaths caused by the virus. India’s population has the lowest vaccination percentage compared to both the USA and Brazil. However, it had the lowest COVID-19 death percentage of its population compared to the other two countries. India with the lowest median age compared to the USA and Brazil also has the lowest GNP/Capita which explains the importance of age and economic activity driving COVID-19 underlying deaths.
Chaturvedi et al. in early 2021 performed a predictive analysis of COVID-19 vaccines for USA, India, and Brazil. Their model estimated COVID-19 to stay under control in the three countries since the expected ‘effective reproduction term’ being less than 1. Also, the USA population will necessitate enormous number of vaccination shots to eliminate COVID-19 compared to Brazil and India and Brazil because of its highest number of active cases34.
7. Conclusions
Age of the population, economic activity in the country, and degree of urbanization are the main drivers for the top three COVID-19 death-producing countries in the world.
8. Conflicts of Interest Statement
The authors have no conflicts of interest to declare.
9. References
1. Curtin S, Tejada-Vera B, Bastian B. National Vital Statistics Reports Deaths: Leading Causes for 2020.; 2023. https://www.cdc.gov/nchs/data/nvsr/nvsr72/nvsr72-13.pdf
2. Xu J, Murphy S, Kochanek K, Arias E. Mortality in the United States, 2021.; 2022. https://www.cdc.gov/nchs/data/databriefs/db456.pdf
3. Ahmad FB. Provisional Mortality Data — United States, 2021. MMWR Morbidity and Mortality Weekly Report. 2022;71. doi:https://doi.org/10.15585/mmwr.mm7117e1
4. GlobalData Plc. The Total Deaths in India (2020 – 2028, people). Globaldata.com. Published 2020. Accessed April 22, 2024. https://www.globaldata.com/data-insights/macroeconomic/the-total-deaths-in-india-240926/
5. GlobalData Plc. The Total Deaths in Brazil (2018 – 2026, People). Globaldata.com. Published 2018. https://www.globaldata.com/data-insights/macroeconomic/the-total-deaths-in-brazil-240844/#:~:text=The%20number%20of%20deaths%20in.
6. United States COVID: 32,938,389 Cases and 587,578 Deaths – Worldometer. www.worldometers.info. https://www.worldometers.info/coronavirus/country/us/#graph-deaths-daily
7. Brazil COVID – Coronavirus Statistics – Worldometer. www.worldometers.info. Accessed April 22, 2024. https://www.worldometers.info/coronavirus/country/brazil/#graph-cases-daily
8. India COVID: 19,164,969 Cases and 211,853 Deaths – Worldometer. www.worldometers.info. https://www.worldometers.info/coronavirus/country/india/#graph-cases-daily
9. Provisional COVID-19 Deaths by Race and Hispanic Origin, and Age | Data | Centers for Disease Control and Prevention. data.cdc.gov. https://data.cdc.gov/NCHS/Provisional-COVID-19-Deaths-by-Race-and-Hispanic-O/ks3g-spdg/data_preview.
10. United States Census Bureau. U.S. Census Bureau QuickFacts: United States. www.census.gov. Published July 1, 2023. https://www.census.gov/quickfacts/fact/table/US/PST045223
11. Johns Hopkins Coronavirus Resource Center. Johns Hopkins Coronavirus Resource Center. Published March 10, 2023. https://coronavirus.jhu.edu/vaccines/international
12. Worldometer. Countries in the World by Population (2024). Worldometers.info. Published July 16, 2023. https://www.worldometers.info/world-population/population-by-country/
13. The World Bank. Urban population (% of total) | Data. Worldbank.org. Published 2021. https://data.worldbank.org/indicator/SP.URB.TOTL.IN.ZS
14. World Bank. GNI per capita, Atlas Method (current US$) | Data. Worldbank.org. Published 2022. https://data.worldbank.org/indicator/NY.GNP.PCAP.CD
15. Population Pyramids of the World from 1950 to 2100. PopulationPyramid.net. Accessed April 22, 2024. https://www.populationpyramid.net/united-states-of-america/2023/#google_vignette
16. Population Pyramids of the World from 1950 to 2100. PopulationPyramid.net. Accessed April 22, 2024. https://www.populationpyramid.net/india/2023/#google_vignette
17. Population Pyramids of the World from 1950 to 2100. PopulationPyramid.net. https://www.populationpyramid.net/brazil/2023/#google_vignette
18. Worldometer. United States Coronavirus. www.worldometers.info. https://www.worldometers.info/coronavirus/country/us/.
19. Bureau of Economic Analysis. GDP by State | U.S. Bureau of Economic Analysis (BEA). Bea.gov. Published 2019. https://www.bea.gov/data/gdp/gdp-state
20. Brazil: number of COVID-19 deaths, by state 2023. Statista. https://www.statista.com/statistics/1107109/brazil-coronavirus-deaths-state/
21. Most populated Brazilian states 2020. Statista. https://www.statista.com/statistics/1182302/brazil-population-state/
22. Brazil: GDP by state 2019. Statista. https://www.statista.com/statistics/1337639/gdp-brazil-by-state/
23. COVID19 STATEWISE STATUS. MyGov.in. Published March 28, 2020. https://www.mygov.in/corona-data/covid19-statewise-status.
24. Population of Indian states 2019 – StatisticsTimes.com. statisticstimes.com. https://statisticstimes.com/demographics/india/indian-states-population.php.
25. Sakshi. GDP of Indian States 2023, Per Capita GDP, Highest & Lowest GDP State. StudyIQ. Published March 25, 2023. https://www.studyiq.com/articles/gdp-of-indian-states/
26. Median age by Indian state, 2021. Accessed 29 Mar 2024. https://twitter.com/Stats_of_India/status/1550069415101988864?lang=en
27. Share of urban population in India from 2011 to 2015. Accessed 29 Mar 2024. https://www.statista.com/statistics/1164998/india-share-of-urban-population-by-state/
28. The Lancet: Largest US state-by-state analysis of COVID-19 impact reveals the driving forces behind variations in health, education, and economic performance | Institute for Health Metrics and Evaluation. www.healthdata.org. https://www.healthdata.org/news-events/newsroom/news-releases/lancet-largest-us-state-state-analysis-covid-19-impact-reveals
29. Pijls BG, Jolani S, Atherley A, et al. Demographic risk factors for COVID-19 infection, severity, ICU admission and death: a meta-analysis of 59 studies. BMJ Open. 2021;11(1):e044640. doi:https://doi.org/10.1136/bmjopen-2020-044640
30. Portela M, Martins M, Lemos M, Lourenço C, Cristina C. COVID-19 inpatient mortality in Brazil from 2020 to 2022: a cross-sectional overview study based on secondary data. International Journal for Equity in Health. 2023;22(1). doi:https://doi.org/10.1186/s12939-023-02037-8
31. Martins JP, Siqueira BA, Sansone NMS, Marson FAL. COVID-19 in Brazil: a 3-year update. Diagnostic Microbiology and Infectious Disease. 2023;107(4):116074. doi:https://doi.org/10.1016/j.diagmicrobio.2023.116074
32. Ghosh P, Ghosh R, Chakraborty B. COVID-19 in India: Statewise Analysis and Prediction. JMIR Public Health and Surveillance. 2020;6(3):e20341. doi:https://doi.org/10.2196/20341
33. Swain CK, Rout SK. Gender and age group-wise inequality in health burden and value of premature death from COVID-19 in India. Aging and health research. 2023;3(3):100151-100151. doi:https://doi.org/10.1016/j.ahr.2023.100151
34. Chaturvedi D, Chakravarty U. Predictive analysis of COVID-19 eradication with vaccination in India, Brazil, and U.S.A. Infection, Genetics and Evolution. 2021;92:104834. doi:https://doi.org/10.1016/j.meegid.2021.104834

